Power BI Essentials: Master Data Visualization & Analytics with Sahil
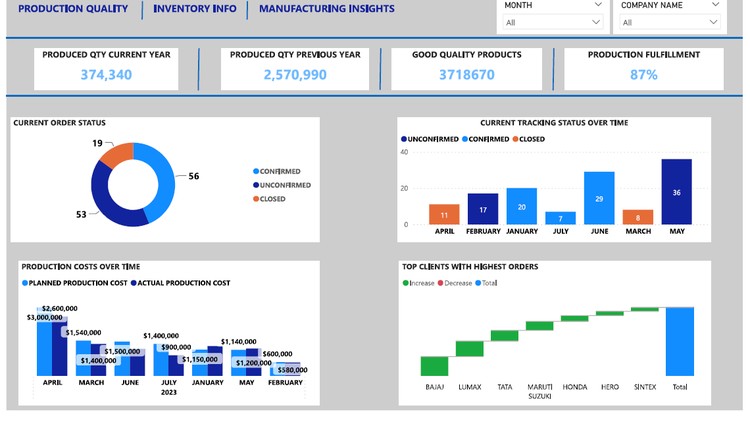
Learn how to harness the true power of Microsoft Power BI to transform raw data into interactive dashboards and actionable insights. This comprehensive course guides you step-by-step through importing and shaping data, building intuitive data models, and crafting stunning visualizations. Whether you're a business analyst, aspiring data professional, or decision-maker, you'll gain hands-on experience and real-world techniques to elevate your reporting and analytics skills. Taught by expert instructor Sahil, this course is your gateway to data-driven decision-making using Power BI.
Created By Sahil Hasija
Get this course with 2000+ of our top related courses with personal plan. Learn more
Try Personal Plan for freeWhat you'll learn
- Install and set up Power BI Desktop
- Import and connect data sources within Power BI
- Build relationships between multiple tables for analysis
- Get an introduction to Power Query Editor for data transformation
- Create visuals such as bar charts, line graphs, and more
- Customize bookmarks to enhance navigation and interactivity
- Write and apply DAX formulas for calculated insights
- Understand the difference between Measures and Columns in DAX
- Learn practical tips and best practices for BI success
- Set up drill-through pages for focused data exploration
- Explore different navigation techniques within dashboards
- Use slicers to filter and interact with your reports
- Visualize data using TreeMap charts
- Enhance visuals with legends for better clarity
- Apply advanced DAX functions to solve complex business problems
- Export and save your reports as PDFs for sharing
Requirements
- Basic knowledge of Microsoft Excel
- Power BI Desktop installed on your system
- No prior programming experience required
Description
Step into the world of data-driven storytelling with this hands-on Power BI course designed for beginners and aspiring data professionals. In Data Visualization Mastery: Power BI Essentials with Sahil, you'll explore the entire workflow of building interactive dashboards—from data loading to visual design—using Microsoft Power BI.
Whether you're aiming to transition into business intelligence, improve your reporting skills, or better understand data, this course gives you the essential tools and knowledge to succeed.
Led by industry expert Sahil, this course offers real-world exercises and practical insights. You'll begin by installing Power BI Desktop and gradually build your skills in data modeling, DAX calculations, custom visuals, bookmarks, drill-throughs, and slicers. You'll also gain clarity on key BI concepts and how they apply in professional environments.
By the end, you'll be able to confidently design dashboards, transform data, and communicate insights effectively through compelling visuals. You'll also receive a certificate of completion to boost your professional profile.
Who this course is for:
- Beginners in business analysis or data visualization
- Professionals looking to pivot into BI and analytics roles
- Anyone restarting their career with in-demand digital skills
- Learners eager to understand Power BI’s integrated toolset
- Those wanting to create visually compelling dashboards and reports
Course content
Instructor

Hello and welcome! I'm Sahil Hasija, a dedicated instructor with a strong background in international trade, business analytics, and technical support. Over the years, I’ve had the opportunity to work with global organizations like IBM and Amazon, gaining valuable experience across industries. Most recently, I served as a Business Analyst, specializing in real estate foreclosures for U.S.-based clients. My role involved building insightful Power BI dashboards to translate business needs into actionable data solutions.
See moreMore Courses by Sahil Hasija

Recieve the best deals..


